Three-Zoom-Level Product Design: Dashboard UX Architecture
Three-Zoom-Level Product Design
The Design Problem
Financial dashboards tend to commit one of two sins: they show everything at once (overwhelming, unactionable) or they hide everything behind navigation (requires knowing what you are looking for). The design challenge was to create an information architecture that answers the most common question first ("am I okay?"), supports investigation when the answer is "maybe not," and provides full detail when needed, all without forcing the user to learn a complex interface.
Three Zoom Levels
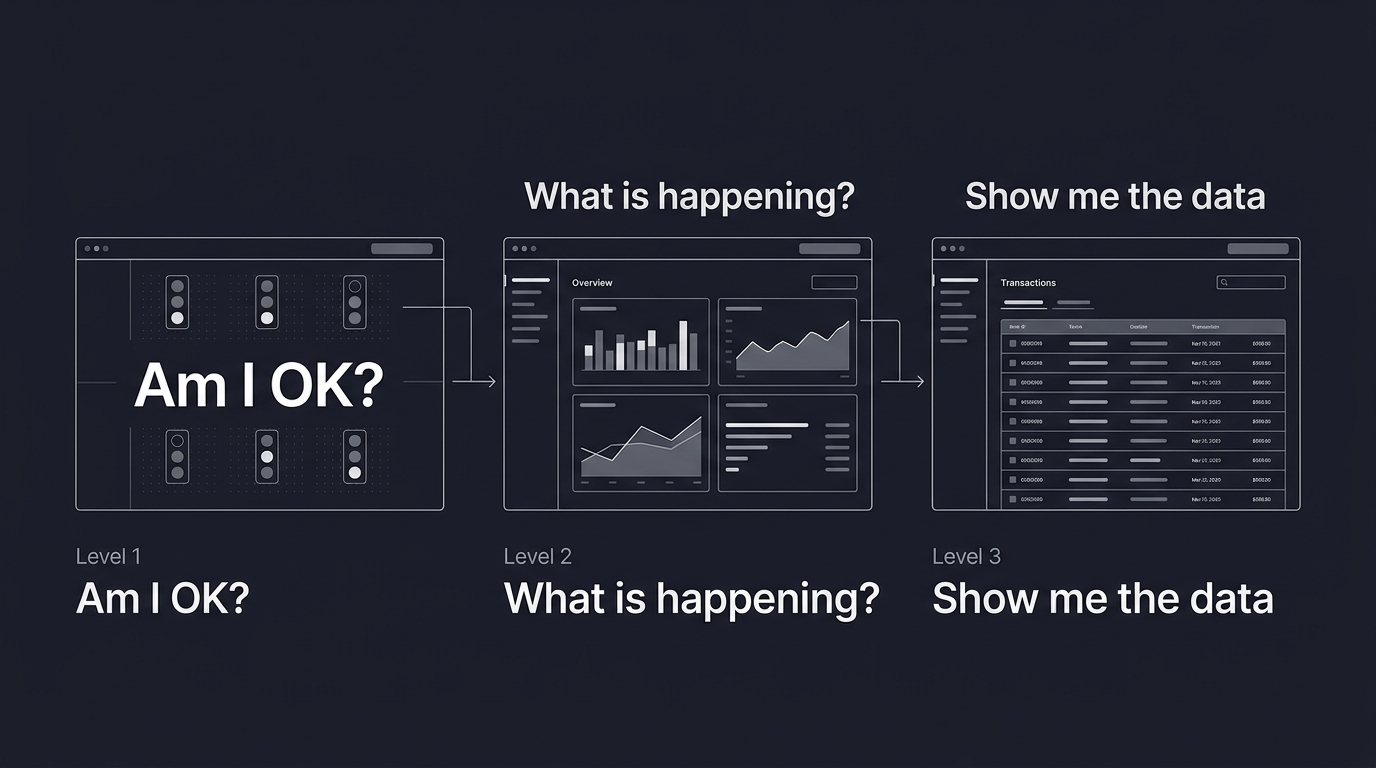
Level 1: Overview. The default view answers one question: "am I okay this month?" A single screen with traffic-light indicators for budget categories, a spend-vs-income ratio, and trend arrows for the key metrics. No charts, no tables, no numbers beyond what is needed for the yes/no/maybe assessment. If everything is green, this is the only screen you need to see.
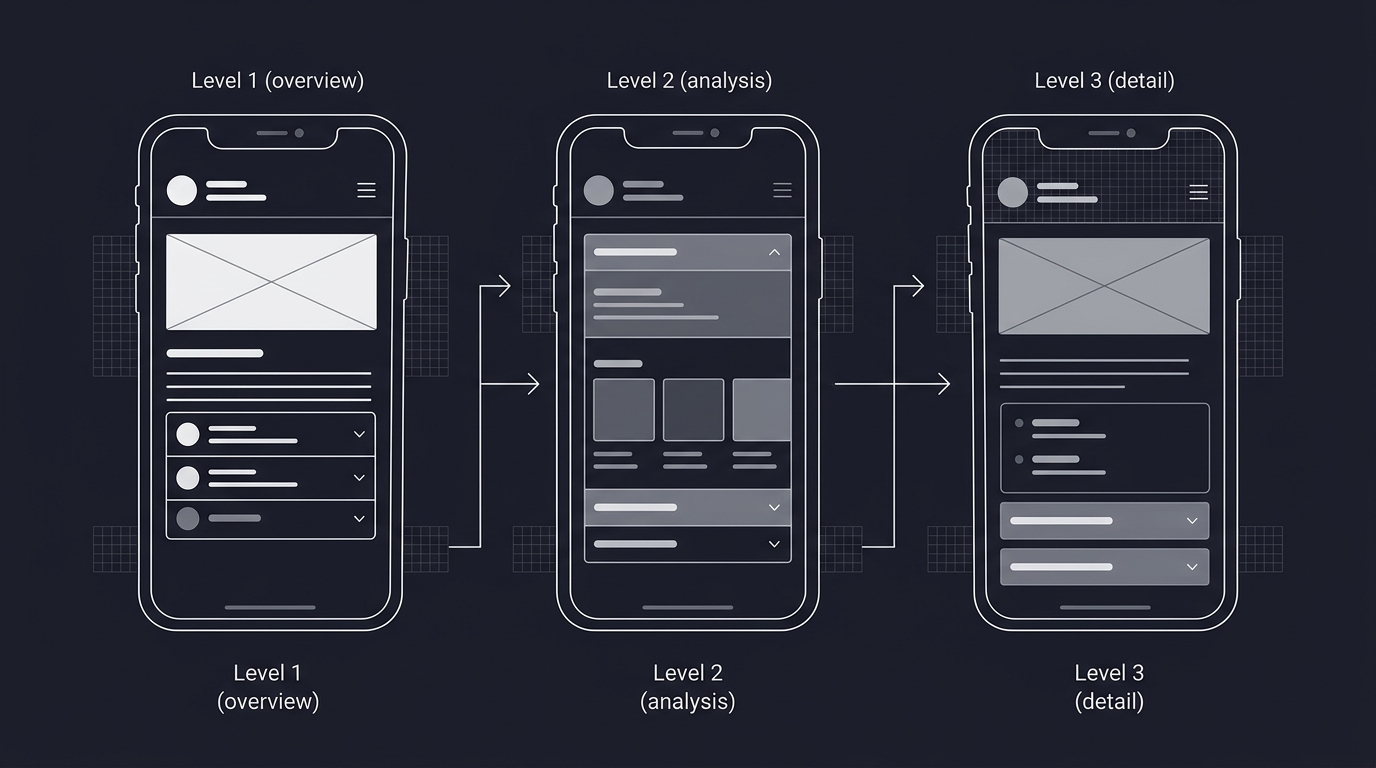
Level 2: Analysis. Clicking into any indicator from Level 1 opens the analysis view for that category. This is where charts live: spending trends over time, category breakdowns, comparison against government economic data (from the open data pipeline), and anomaly highlighting. The analysis view answers "what's happening?" for a specific area of concern.
Level 3: Detail. Drilling further reveals individual transactions, their categorization, and the ability to recategorize or annotate. This is the audit layer, used when the analysis raises a question that only the raw data can answer.
Design Principles
Progressive disclosure: each level adds detail, never removes it. The user always knows how to go deeper and how to go back up. Context preservation: when you drill into a category at Level 2, the overview indicators remain visible in a collapsed state so you never lose the bigger picture. Mobile-first: Level 1 is designed to work on a phone screen. You check your finances on the bus, not at a desk.
What This Demonstrates
Product thinking applied to a personal project: the design is driven by user needs (the user happens to be the builder), not by feature accumulation. Information architecture that scales from glance to deep analysis without mode switching. And the ability to articulate design decisions in terms of user problems and cognitive load, not just aesthetic preferences.
Part of a dashboard project. See also: Full-Stack Engineering, Government Open Data Pipeline, Infrastructure, and Brand & Design System.
* Images are conceptualized, not the real implementation to protect client's intellectual right